

Bulls and Bears : Nifty ends in green; midcaps and smallcaps underperform largecaps by Motilal Oswal Financial Services Ltd
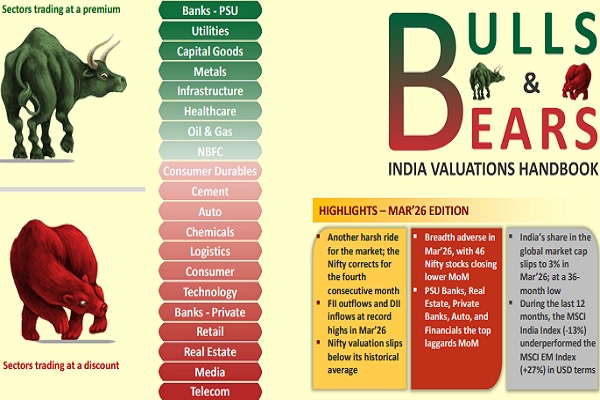
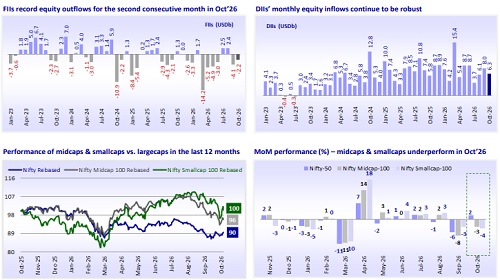
* Nifty manages to close in green: The Nifty-50 managed to close in the green in Oct’26 after two consecutive months of decline. The index oscillated by 995 points before closing 433 points higher (or 1.9% MoM) at 23,053. The Nifty is down 11.8% in CY26YTD. The Nifty Smallcap 100 (-4.1%) and Nifty Midcap 100 (-3.4% MoM) underperformed the Nifty-50 during the month. Over the last 12 months, largecaps have fallen 10%, underperforming midcaps (-4% YoY) and smallcaps (flat YoY). Over the last five years, midcaps (CAGR: 13.5%) have notably outperformed largecaps (CAGR: 5.5%) by 58%, while smallcaps (CAGR: 11.4%) have markedly outperformed largecaps by 41%.
* FIIs record outflows for the second consecutive month; DII inflows remain strong: In Oct’26, FIIs recorded outflows of USD2.2b. FII equity outflows stand at USD30.4b in CY26YTD. DII inflows remained strong in Oct’26 at USD6.3b, taking DII equity inflows to USD74.1b in CY26YTD.
* Breadth largely balanced in Oct’26: Sector-wise, Technology (+18%), Media (+3%), PSU Banks (+3%), Telecom (+3%), and Healthcare (+3%) were the key gainers MoM. Meanwhile, Metals (-8%), Capital Goods (-7%), Oil & Gas (-5%), Power (-4%), and Real Estate (-4%) were the top laggards MoM. The market breadth was largely balanced in Oct’26, with 22 Nifty stocks closing higher. TCS (+22%), Infosys (+19%), Tech Mahindra (+18%), HCL Tech (+16%), and Trent (+15%) were the top gainers MoM, while Shriram Finance (-16%), Adani Enterp. (-11%), Nestle (-11%), Tata Steel (-9%), and Coal India (-8%) were the key laggards
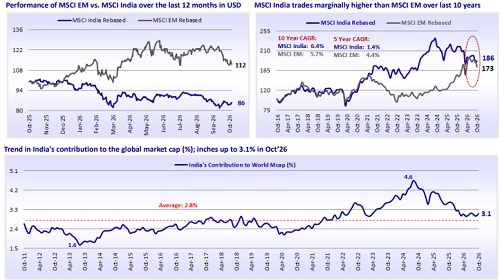
* India among the gainers in Oct’26: Among the key global markets, Germany (+2%), India (+2%), and the UK (+1%) ended higher MoM. However, Indonesia (-17%), Korea (-16%), Brazil (-10%), MSCI EM (-8%), China (-6%), Taiwan (-6%), Japan (-5%), and the US (-1%) ended lower MoM in Oct’26. During the last 12 months, the MSCI India Index (-14%) has underperformed the MSCI EM Index (+12%) in USD terms. Over the last 10 years, the MSCI India Index (CAGR: 6.4%) has delivered a marginally higher CAGR than the MSCI EM Index (CAGR: 5.7%). In P/E terms, the MSCI India Index is trading at a 43% premium to the MSCI EM Index, below its historical average premium of 72%.
* Earnings review 2QFY27 – Strong broad-based earnings growth: As of 31st Oct’26, 230/35 companies within the MOFSL Universe/Nifty have announced their 2QFY27 results.. Earnings of the aforesaid 230 MOFSL Universe companies witnessed strong growth, demonstrating a broad-based outperformance across all key aggregates. For the MOFSL Universe, sales/EBITDA/PAT grew 26%/24%/33% YoY (vs. our est. of +19%/+14%/+19%), the highest growth in 12 quarters; excl. OMCs, earnings grew 30% YoY vs. our est. of 22% YoY. This growth was fueled by BFSI, Metals and Oil & Gas. These three sectors contributed 78% to the incremental YoY earnings growth. In contrast, Healthcare and Cement were the only sectors that dragged down the overall aggregates
* Valuation and view: The Nifty is trading at a 12-month forward P/E ratio of 17.1x, below its LPA of 20.9x (at an 18% discount). Further, its P/B of 2.5x represents a 12% discount to its historical average of 2.9x. The 12-month trailing P/E for the Nifty, at 19.8x, is below its LPA of 23.2x (at a 15% discount). At 2.8x, the 12-month trailing P/B ratio for the Nifty is below its historical average of 3.2x (at an 11% discount). Notably, more than half of the sectors trade at a discount to their historical averages. Healthcare, PSU Banks, Capital Goods, Utilities, Metals, Capital Markets, Defense, EMS, Logistics, and Textile trade at a premium to their LPA valuations, while Oil & Gas, Consumer, Private Banks, Technology, Real Estate, Retail, Telecom, NBFCs, Consumer Durables, Infrastructure, and Chemicals trade at a discount to their LPA. India’s ongoing market consolidation, alongside continued earnings recovery from FY25 lows, has led to a sustained cooling in valuations from the highs seen in 2024. With valuations well below their peaks, healthy earnings growth, and a resilient macroeconomic environment, we believe the risk-reward profile for Indian equities has improved meaningfully
* Top Nifty-50 Ideas: Bharti Airtel, ICICI Bank, Larsen & Toubro, Titan Company, Mahindra & Mahindra, Adani Enterprises, Eternal, Bharat Electronics, Shriram Finance, BSE, and Apollo Hospitals. Top non-Nifty-50 Ideas: TVS Motor, Lenskart Solutions, Indian Hotels, GE Vernova T&D, Meesho, SBI Funds Management, Coforge, Dixon Tech, Radico Khaitan, RBL Bank, Physicswallah, Inventurus Knowledge Solutions, Kirloskar Oil Engines, and SPR Auto Tech
 Second successive month of FII outflows; DII inflows remain strong
MSCI India underperforms MSCI EM over the last 12 months
* Valuation and view: The Nifty is trading at a 12-month forward P/E ratio of 17.1x, below its LPA of 20.9x (at an 18% discount). Further, its P/B of 2.5x
represents a 12% discount to its historical average of 2.9x. The 12-month trailing P/E for the Nifty, at 19.8x, is below its LPA of 23.2x (at a 15% discount).
At 2.8x, the 12-month trailing P/B ratio for the Nifty is below its historical average of 3.2x (at an 11% discount). Notably, more than half of the sectors
trade at a discount to their historical averages. Healthcare, PSU Banks, Capital Goods, Utilities, Metals, Capital Markets, Defense, EMS, Logistics, and
Textile trade at a premium to their LPA valuations, while Oil & Gas, Consumer, Private Banks, Technology, Real Estate, Retail, Telecom, NBFCs, Consumer
Durables, Infrastructure, and Chemicals trade at a discount to their LPA. India’s ongoing market consolidation, alongside continued earnings recovery
from FY25 lows, has led to a sustained cooling in valuations from the highs seen in 2024. With valuations well below their peaks, healthy earnings
growth, and a resilient macroeconomic environment, we believe the risk-reward profile for Indian equities has improved meaningfully.
For More Research Reports : Click Here
For More Motilal Oswal Securities Ltd Disclaimer
http://www.motilaloswal.com/MOSLdisclaimer/disclaimer.html
SEBI Registration number is INH000000412


Tag News
Nifty Opens Gap-Up Above Crucial 23,550 Resistance - GEPL Capital