Fund Folio : Equity AUM rises for the 12th successive year; net inflows moderate in CY25 by Motilal Oswal Financial Services Ltd

Key observations
* CY25 concluded with yet another year of positive returns for the Indian markets, marking the tenth consecutive year of positive returns. The Nifty touched a fresh high of 26,326 before ending CY25 at 26,130, up 10.5% YoY. The year was marked as one of the most volatile years for Indian equity markets. Geopolitical tensions, US trade-tariff headwinds, the Japan carry-trade unwind, sharp INR depreciation, moderate domestic corporate earnings, muted consumption growth, and concerns around relatively high valuations together led to record FII selling of Indian equities during the year. DII flows into equities were the highest ever at USD90.1b in CY25 vs. inflows of USD62.9b in CY24, with just one year of outflows since CY15. Conversely, FIIs witnessed the highest ever equity outflows of USD18.8b in CY25 vs. outflows of USD0.8b in CY24.
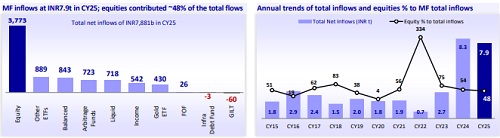
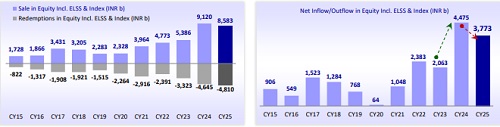
* However, despite the challenges, domestic MFs saw their equity AUM rise for the 12th consecutive year to INR39t (+17% YoY) in CY25. AUM growth was fueled by an uptrend in market indices (Nifty: +10.5% YoY). However, lower equity scheme sales (at INR8,583b; -5.9% YoY) and higher redemptions (at INR4,810b; +3.5% YoY) led to a fall in net inflows to INR3,773b in CY25 (-15.7% YoY) from INR4,475b in CY24.
* The MF industry’s total AUM increased 20% YoY (INR13.3t) to INR80.2t in CY25, propelled by the growth in equity funds (INR5,657b), other ETF funds (INR2,011b), balanced funds (INR1,418b), liquid funds (INR1,265b), income funds (INR1,237b), and Gold ETFs (INR833b).
* Investors continued to park their money in mutual funds, with inflows and contributions in systematic investment plans (SIPs) reaching a new high of INR310b in Dec’25 (up 5.3% MoM and 17.2% YoY).
A few interesting facts
* The year saw a notable change in the sector and stock allocation of funds. The weight of domestic cyclicals improved 170bp to 63.2%, aided by an increase in the weights of BFSI and Automobiles, while the weights of Capital Goods, Consumer Durables, Cement, Chemicals, Infrastructure, Retail, Real Estate, Media, and Textiles moderated (refer to page 4 for detailed charts).
* The weight of Global Cyclicals also increased 50bp to 8.7%, led by Metals.
* Defensives’ weightage declined 220bp to 28.1%, dragged down by Technology, Healthcare, Utilities, and Consumer.
* Automobiles saw a rise in weight to 8.6% (+40bp YoY) in CY25, improving its position to second from third a year ago.
* Technology’s position declined to third place from second a year ago, as the weightage declined by 150bp YoY to 7.9%.
* Private Banks’ weight surged to 17.6% (+100bp YoY).
* Capital Goods saw a decrease in weight to 7.1% (-70bp YoY).
* The top sectors where MF ownership vs. the BSE 200 was at least 1% lower were Oil & Gas (17 funds under-owned), Private Banks (16 funds underowned), Consumer (16 funds under-owned), Utilities (13 funds under-owned), and Metals (12 funds under-owned).
* The top sectors where MF ownership vs. the BSE 200 was at least 1% higher were Healthcare (14 funds over-owned), NBFCs (11 funds over-owned), Chemicals (10 funds over-owned), Consumer Durables (10 funds over-owned), and Capital Goods (8 funds over-owned).
For More Research Reports : Click Here
For More Motilal Oswal Securities Ltd Disclaimer
http://www.motilaloswal.com/MOSLdisclaimer/disclaimer.html
SEBI Registration number is INH000000412


More News

Fund Folio : Net equity inflows pick up, underpinned by lower redemptions by Motilal Oswal F...