Gold at over $4,400 expensive; silver relatively cheap at ~$66: Monarch PMS
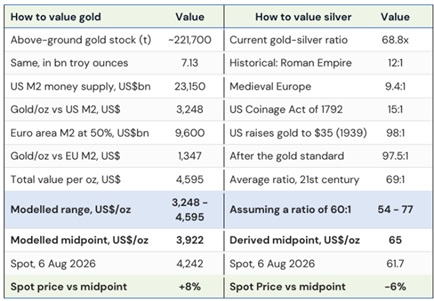
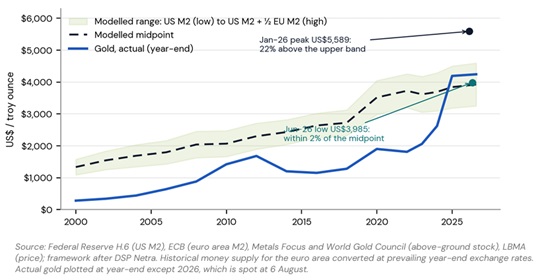
According to Monarch PMS gold's modelled range in is cited as US$3,248 to US$4,595, with a midpoint of US$3,922. At US$4,242 (as of 6th August 2026), gold trades about 8% above the midpoint and about 8% below the upper band.
Considering its January peak of US$5,589, the metal was trading 22% above the ceiling of the entire range. “That is the definition of an overshoot, and the cleanest single piece of evidence that the January top was speculative rather than fundamental,” says Monarch PMS.
In contrast, gold bottomed at US$3,985 in June—within 2% of the modelled midpoint of US$3,922. The correction stopped almost exactly at fair value and turned. According to the report, this is a sign that the people selling gold during the fall were probably short-term, highly leveraged investors who were forced or chose to sell when prices dropped. By the time gold reached its low, the sellers had largely been flushed out, and buyers who believed gold was attractively priced stepped in. The continued buying by central banks supports this interpretation.
Gold price versus modelled value: 2000 to 2026
As per the above graph, gold spent twenty-five years below its modelled value, closed the gap in 2025, overshot the entire range in January 2026, and has now settled between the midpoint and the upper band. According to Monarch PMS - “That is a market that has repriced to fair value and is deciding what to do next, not one that has exhausted itself.”
Silver, valued through gold’s lens
Monarch PMS values silver through its ratio to gold. History gives a wide but instructive range. Under the Roman Empire the ratio was roughly 12:1; in medieval Europe 9.4:1; the US Coinage Act of 1792 fixed it at 15:1. Once the monetary link was cut, the ratio blew out to 98:1 when the US revalued gold to $35 in 1939, and to 97.5:1 after the gold standard was abandoned altogether. The 21st century average is 69:1.
Using a normalised 60:1 against gold’s price bands gives silver a modelled range of US$54 to US$77 with a midpoint of US$65. At US$61.7, silver trades about 6% below its modelled midpoint. Gold trades 8% above. On this framework, silver is the cheaper of the two, which is the opposite of what the January price action implied.
The ratio itself tells the same story. At the January peak the ratio compressed to 46x, tighter than at any point since 2011 and far through the 60:1 normalisation assumption. Today it sits at 69x, almost exactly the 21st century average. Silver has given back its entire relative overshoot while gold has given back only part of its absolute one. In other words, according to Monarch PMS’ analysis, at over US$4,400 gold not yet cheap, that at US$61.7 silver still is.
Above views are of the author and not of the website kindly read disclaimer