Index Likely to Open Subdued Amid Geopolitical Tensions - ICICI Direct Ltd

Nifty : 23898
Technical Outlook
Day that was ..
The sharp surge in crude oil prices amid geopolitical escalations dented the market sentiment, resulting in Nifty extended losses over fourth consecutive week to settle at 23898, down 1.15%. Defying the benchmark move, small caps index endured its record setting spree over third week in a row and settled the week with marginal gains. Sector rotation continued with Realty, Oil & Gas gaining traction while Auto, Consumer Durables seen profit booking.
Technical Outlook :
• The lack of follow-through strength above previous session’s high persisted over eighth session in a row. As a result, weekly price action formed a bear candle carrying lower high-low, indicating prolonged corrective bias.
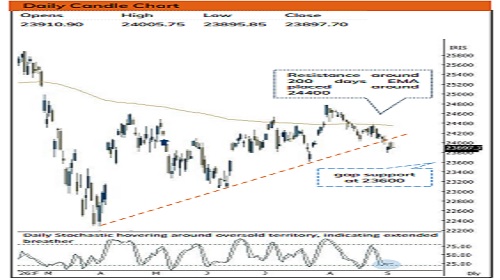
• Index is likely to witness subdued opening tracking geopolitical escalations and elevated crude prices. Nifty extended correction on the backdrop of 4 months rising trendline breakdown. However, broader market remained in limelight yet again. Therefore, focus should be on the broader market while Nifty witness subdued traction.
• Going ahead, key support is placed at 23600 being July month low. Meanwhile, a decisive close above psychological mark of 24000 would confirm conclusion of corrective phase and open the door for 24400 in the coming weeks.
• Despite ongoing volatility Nifty continues to maintain higher high-low structure on the larger degree charts, indicating structural uptrend is intact. The index has formed sequential higher bottoms off April low (22182). Each higher base has formed a peculiar pattern of arresting intermediate correction around 61.8% to 80% retracement of prevailing uptrend.
• The current ~990 points pullback precisely align with the structural rhythm, retracing 80% of Jul-Aug 1150 points rally. We expect index to maintain the same rhythm and form a higher base in coming weeks.
• Historically, two decades data suggest that September has been the volatile month. However, such volatility has paved the way for direction move in subsequent months.
• Inflows into FCNR deposits provided strong support for the Indian Rupee, driving its recent appreciation (up 0.9%). Consequently, USD/INR recorded breakdown from 16 months rising trend line. This fall could provide a favorable backdrop for the broader equity markets and trigger fresh buying interest.
• After Brent crude peaked at $120 in March, intermediate rallies have exhausted around the 80% retracement of prevailing decline. Following the historical rhythm, the current 80% mark is placed at 97 which would be the key level to watch out for.
• Key Monitorable US Inflation print
Intraday Rational :
• Trend – Supportive efforts emerged from 80% retracement of last up move
• Levels – Buy around 27th July gap-area
Nifty Bank : 57370
Technical Outlook
Week that was :
Bank Nifty ended the week on a flat note, at 57370 on back of mixed global cues.
Technical Outlook :
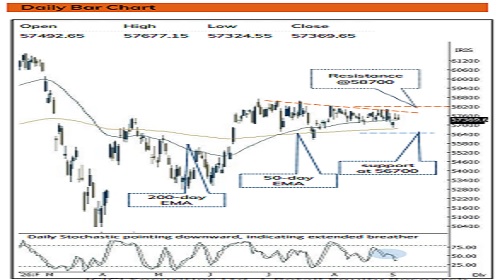
• The Index started the week on negative note and thereafter found supportive efforts in vicinity 50 days EMA (barring Wednesday session) then index remained within Mondays high-low range. As a result, the daily price action formed high wave doji candle, indicating indecisiveness at current levels.
• Amid geopolitical volatility, Index continues to hold above 50-day and 200-day EMA and index remains broadly defined range between 56700 and 58000. Holding key support of 56700 will keep pullback options open towards 58000 levels on the higher side.
• In the process, strong support is placed around 56700 being 200 days EMA .
• The PSU Bank Index formed high wave candle consolidating above 50-day EMA indicating elevated buying demand. Going ahead, follow through strength above last week (8658) high would open the door for next leg of up move towards 9100 levels
Intraday Rational :
• Trend - Prolongation of consolidation above 200 days EMA, indicating positive bias
• Levels : Sell around 80% retracement of 2 days range
Please refer disclaimer at https://secure.icicidirect.com/Content/StaticData/Disclaimer.html
SEBI Registration number INZ000183631