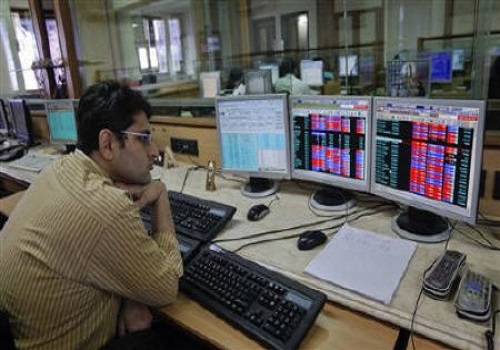
Market Commentary (closing) for 15th October 2026 by Pabitro Mukherjee, Deputy Vice President-Research, Bajaj Broking

Below the Market Commentary (closing) for 15th October 2026 by Pabitro Mukherjee, Deputy Vice President-Research, Bajaj Broking
Market Closing Commentary
Indian benchmark indices opened on a subdued note but gained momentum as the session progressed, with the Nifty and Sensex closing near their respective day’s highs despite weak global market cues. Easing US 10-year Treasury yields provided some support to investor sentiment, helping domestic markets recover and extend their gains
At close, the Nifty 50 surged 1.66% to 22,997, while the Sensex gained 2.10% to 74315.
On the sectoral front, IT, Auto, Financial Services, Realty and Pharma were the key gainers, while PSU Banks, Media, FMCG and Energy remained the major laggards.
The broader market showed a mixed trend, with the Nifty Small cap 100 declining 1.31% and the Nifty Midcap 100 falling 0.36%, indicating relatively stronger participation in large-cap stocks.
Nifty Outlook
Index formed a strong bullish candle with a higher high and a higher low signaling strong pullback after previous session consolidation, index in the process closed above the 20 days EMA. Nifty started the session on a flat note, index thereafter gained strong momentum in the first half of trade as it moved above last week high of 22,776 and rallied to an intraday high of 23,056 in the mid-session. Profit booking in the last hour of trade saw the index gave up some of its intraday gains and closed the session at 22930 level.
Nifty on Thursday session tested the resistance area of 23,000-23,100 being the confluence of recent breakdown area and the retracement of previous decline. Going ahead, a move above 23,100 will signal extension of the current pullback towards 23,500 levels. Failure to move above 23,100 will signal consolidation in the range of 22,600-23,100.
On the higher side Index need to start forming higher high and higher low on a sustained basis in the weekly chart and reclaim 23,100 levels being the recent breakdown area to signal a pause in the last 2 months sharp decline.
Bank Nifty Outlook
Bank Nifty formed a bullish candle on the daily chart, maintaining its higher-high and higher-low structure following the previous session’s profit booking, indicating a strong pullback and improving near-term momentum.
The index reclaimed the immediate resistance of 55,500 and rallied to an intraday high of 56,065 before witnessing some profit booking in the final hour, eventually closing at 55,810. The index has also tested the 55,900-resistance zone, corresponding to the gap-down area of September 24.
Going ahead, a decisive breakout and sustained move above 56,065, the Thursday high, could extend the upside towards 56,500. However, failure to sustain above this level may lead to consolidation in the 55,300–56,000 range.
On the weekly chart, Bank Nifty is negating its lower high and lower low structure and is trading above the previous week’s high, keeping the broader recovery intact. A sustained breakout above the crucial resistance zone of 56,000–56,065 would strengthen the bullish bias and open the door for further upside.
Above views are of the author and not of the website kindly read disclaimer












More News

Quote on Bank Nifty 15th October 2026 by Vatsal Bhuva, Technical Analyst at LKP Securities