Morning Bell 22nd April 2026 by Bajaj Broking

Nifty Outlook
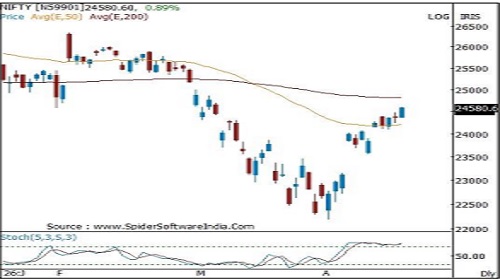
The index formed a bullish candlestick pattern with a higher high and a higher low highlighting continuation of the up move . Index in the process sustaining above its 50 days EMA.
Bias remain positive above last Wednesday gap up area of 23 ,850 - 24 ,100 . Index is expected to maintain positive bias and gradually head towards 24 ,700 - 24 ,800 levels being the confluence of the 200 days EMA and the 61.8% retracement of the entire decline 26 ,373 to 22 ,183.
Volatility is expected to remain high on account of the geopolitical tension and volatile crude oil prices
Short - term support is positioned around 23 ,600 – 23 ,500 range being the confluence of last week low and 38 .2% retracement of the last 3 weeks pullback (22 ,183- 24 ,601). Forming higher high and higher low in weekly chart will keep the current pullback trend intact .
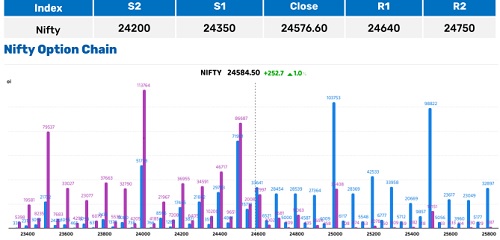
Intraday Support & Resistance
* Nifty is entering the monthly expiry series with derivatives data indicating a constructive outlook. Put writing interest remains broad - based across strikes, while notable fresh additions at 24,500 reinforce it as a key support zone.
* In-the - money call writers have reduced positions and shifted exposures to higher strikes, reflecting improving bullish sentiment. Immediate resistance is seen at 24,700, where call writing remains active; a sustained move above this level could open the path for further upside.
* A break below 24,400 would weaken the positive setup and may result in a range - bound or sideways phase.
* Overall, the bias remains positive, and any corrective dips may continue to be viewed as buying opportunities.
Bank Nifty Outlook
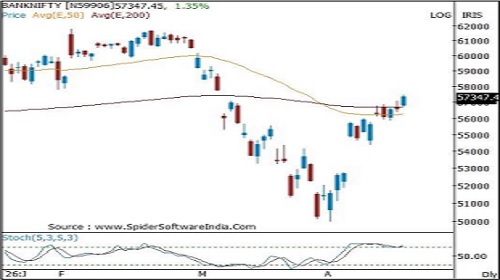
The index formed a bullish candlestick pattern with a higher high and a higher low highlighting continuation of the up move . Index in the process closed firmly above the 200 days EMA.
Bias remain positive above last Wednesday gap up area of 55 ,600 - 55 ,850 . Index is expected to maintain positive bias and gradually head towards 57,800 and 58 ,500 levels being the previous breakdown area and key retracement of previous decline . Volatility is likely to remain high on account of the geopolitical tension and volatile crude oil prices
From a short -term perspective, support is placed in the range of 54 ,500 –54 ,000 zone, being the confluence of the last week low and 38 .2% retracement of the last 3 weeks pullback (49 ,955 - 57,456 ). Forming higher high and higher low in weekly chart will keep the current pullback trend intact .
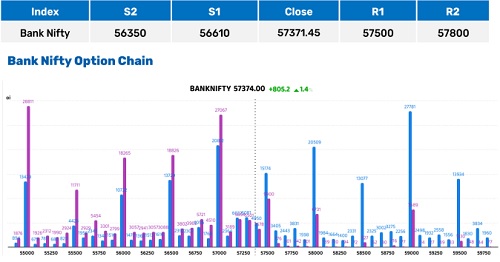
Intraday Support & Resistance
* Strong put writing presence across 57,000-57,500 signals a supportive undertone and sustains a positive outlook.
* Call writing activity remains relatively muted, while unwinding at 58,000 and 59,000-60,000 suggests easing resistance and scope for upside, though with caution. 57,000 remains a critical support level; only a breach below this mark would alter the positive bias.
* As long as this level holds, declines may be considered buying opportunities. Immediate resistance is placed at 57,500, where limited call writing exists; a decisive move above this level could trigger an upside extension toward 58,000.
Above views are of the author and not of the website kindly read disclaimer