MOSt Quantitative Outlook Monthly - July, 2026 by Motilal Oswal Wealth Mangement
Bank Nifty
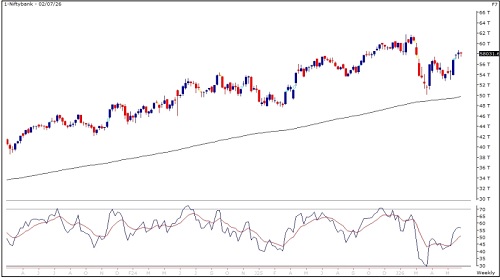
Bank Nifty started the June month on a flattish note and staged a strong comeback of the bulls. The index moved by around 5700 points in the month and follow up buying remained intact at higher levels, resulting in outperformance of the rate sensitive index. On the monthly scale it formed a strong bullish candle reflecting dominance of the buyers. Price action suggests that a hold above 57000 zones could see momentum driving towards 58750 then 59500 zones while on the downside support is placed at 56750 and then 56000 zones.
Nifty Defence Index
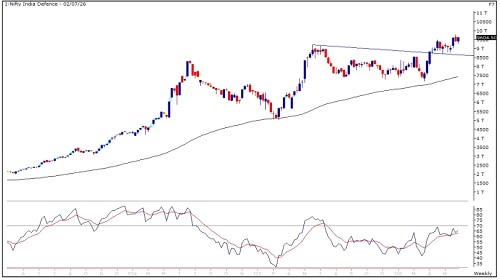
The Nifty Defence Index is currently trading near 9550 after successfully retesting its breakout zone near 9400, indicating that the breakout remains intact and buyers continue to defend lower levels. The index maintains a strong technical structure by trading above its 20, 50, 100 and 200 DEMA, while the RSI continues to trend positively, reflecting sustained momentum and underlying strength. The successful retest of the breakout area further enhances the probability of an extension of the ongoing uptrend. A sustained move above 9750 is expected to act as the next bullish trigger, opening the door for an advance towards 9900 and 10000. Immediate support levels are placed at 9000, followed by 8800 zones
Investment in securities market are subject to market risks, read all the related documents carefully before investing.
Relative Rotation Graphs (RRG):
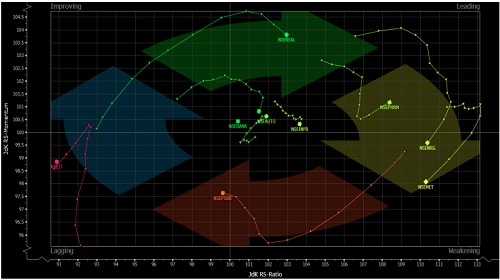
Relative rotation graphs chart shows the relative strength and momentum for group of Stocks/ Indices. It allows us to compare a security against the benchmark to see if it is outperforming or underperforming the benchmark. It is derived on Relative strength in which value of a sector is divided by the value of index mainly a benchmark which allows us to compare the performance of the sector. Relative Strength ratio is normalized to oscillate around 100 (plotted on X axis) i.e Jdk RS- Ratio along with this it provides the speed and direction of the Relative strength ratio (plotted on Y axis) i.e Jdk RS- momentum. The scatter plot is divided into four quadrants i.e Leading, Weakening quadrant, Lagging and Improving quadrant.
The analysis of sectoral RRG shows that Pharma, Realty, Auto, Nifty Bank and Infrastructure are in the Leading Quadrant, which indicates strength going ahead. Energy and Metal are placed in the Weakening Quadrant, suggesting that momentum is likely to decline. PSU Banks and IT are in the Lagging Quadrant, which shows that both strength and momentum are missing
Investment in securities market are subject to market risks, read all the related documents carefully before investing.
Nifty Realty Index
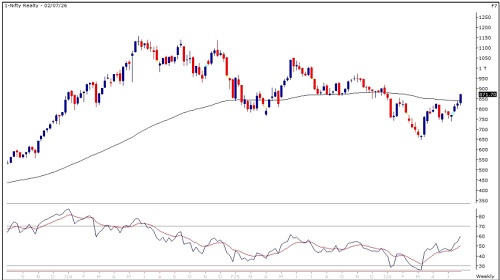
The Nifty Realty Index has registered a breakout above its 200 DEMA, indicating a notable improvement in the longterm trend. The index has also negated its previous pattern of lower highs and lower lows on the daily chart, reflecting a positive shift in market structure. The index continues to trade comfortably above its 20, 50, 100 and 200 DEMA, while the RSI is trending higher, signaling strengthening momentum and improving buying interest. A sustained move above the 870 mark is likely to confirm the breakout and attract fresh participation. Based on the current technical setup, the index is well-positioned to advance towards 920 and 1000 levels. On the downside, immediate support is placed at 760, followed by a stronger support zone near 720.
RRG For Nifty Realty
The analysis of RRG for realty stocks shows that Prestige Estates and Godrej Properties are in the Leading Quadrant, which indicates strength going ahead. Phoenix Mills and Oberoi Realty are placed in the Weakening Quadrant, suggesting that momentum is likely to decline. Lodha and DLF are in the Improving Quadrant, indicating that strength is still low but momentum is gradually improving
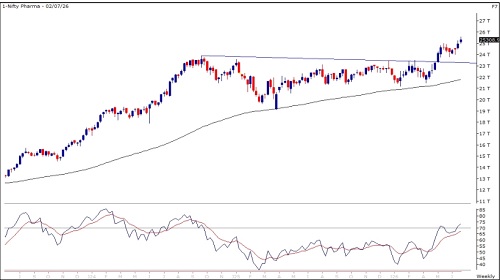
Nifty Pharma Index
The Nifty Pharma Index is currently trading around 25200 zones and continues to hold firmly above its recent breakout zone, highlighting sustained strength in the prevailing uptrend. The price action suggests that the sector remains in a healthy consolidation phase following a sharp rally, which could provide the foundation for the next leg of the up move. The index is comfortably trading above its 20, 50, 100 and 200 DEMA, reaffirming the bullish trend across multiple timeframes. Momentum indicators also remain supportive, with the RSI holding above its equilibrium level, indicating continued buying strength. A decisive close above 25600 could trigger renewed momentum, paving the way for an advance towards 26000 and 26400. On the downside, immediate support is seen at 24800, while a stronger demand zone is placed around 24200.
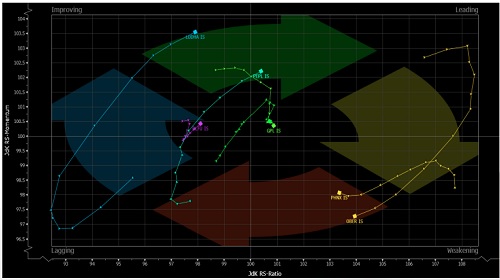
RRG For Nifty Pharma
The analysis of RRG for Pharma stocks shows that Gland Pharma, Laurus Labs, Zydus Life and Biocon are in the Leading Quadrant, which indicates strength going ahead. Aurobindo Pharma, Ajanta Pharma and Torrent Pharma are placed in the Weakening Quadrant, suggesting that momentum is likely to decline. Glenmark Pharma, Lupin, IPCA Labs, Dr. Reddy’s, Alkem Laboratories and Sun Pharma are in the Lagging Quadrant, which shows that both strength and momentum are missing. Cipla is in the Improving Quadrant, indicating that strength is still low but momentum is gradually improving
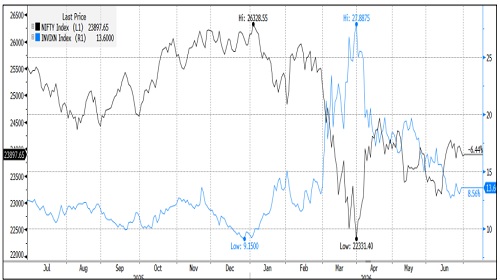
India VIX
India VIX decreased by 15.69% from 16.13 to 13.60 levels in the June series. It cooled off below 12 levels and paved way for smart buying at lower levels.
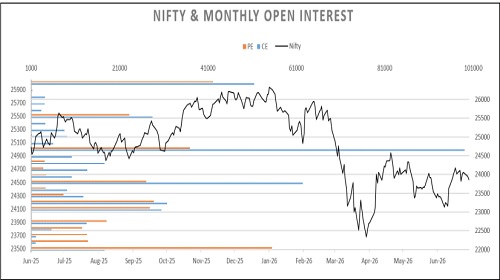
Nifty OI V/S Price
Rollover of Nifty stood at 80.3%, which is higher than the quarterly average of 74%. In the June series, open interest increased by 25.9% while the index marginally fell by 0.2% on an expiry-to-expiry basis. Rollover in Bank Nifty stood at 77.2%, which is in line with its quarterly average of 77%. Bank Nifty ended the June series with gains of 4.4% with a decrease in open interest by 7% indicating short covering in the rate sensitive index. Nifty begins the July series with open interest of 19.45 mn shares as compared to 15.45 mn shares at the start of the June series.
Nifty index began the June series on a flattish note but drifted lower to 23000 zones in the first half of the series. It witnessed renewed buying from support levels and recovered to 24250 zones. Some rub off was seen towards the end and it ended with a tug of war between the bulls and the bears. On an expiry-to-expiry basis, Nifty formed a Dojisort of a candle with longer lower wick which suggests support based buying is intact but a decisive follow up is required at the higher levels. Put Call Ratio based on Open Interest of Nifty started the series near 1.02 and oscillated between 0.69 to 1.41 levels to finally end the series again at 1.02. On option front, Maximum Call OI is at 24000 then 25000 strike while Maximum Put OI is at 24000 then 23000 strike. Call writing is seen at 24000 then 24500 strike while Put writing is seen at 24000 then 23000 strike. Option data suggests a broader trading range in between 22900 to 24900 zones while an immediate range between 23300 to 24300 levels.

For More Research Reports : Click Here
For More Motilal Oswal Securities Ltd Disclaimer
http://www.motilaloswal.com/MOSLdisclaimer/disclaimer.html
SEBI Registration number is INH00000041


Tag News
Nifty, Sensex extend gains as IT, realty and pharma stocks lead rally


More News

Capital Market : Stable market environment By Motilal Oswal Financial Services Ltd