Net equity inflows pick up, underpinned by lower redemptions– Motilal Oswal's Fund Folio Report

Key observations
* The Nifty ended its two-month winning streak in Aug'26, declining 1.2% MoM to close at 24,080. Notably, the index remained extremely volatile, swinging ~781 points during the month before closing 303 points lower. In Aug'26, FIIs recorded inflows for the second consecutive month at USD2.4b. DII inflows remained strong in Aug'26 at USD6.1b.
* Total AUM of the MF industry increased for the third consecutive month to INR87.1t in Aug'26 (+1.5% MoM), primarily led by an MoM increase in the AUM of income (INR575b), liquid (INR376b), gold ETFs (INR179b), arbitrage (INR107b), and balanced (INR78b) funds.
* Equity AUM of domestic MFs (including ELSS and index funds) was marginally down to INR41.8t in Aug'26 (-0.2% MoM), owing to a decline in market indices (with the Nifty down 1.2% MoM). Notably, sales of equity schemes rose 0.9% MoM to INR805b, with a slower pace of redemptions to INR488b (down 8.9% MoM). Consequently, net inflows increased in Aug'26 to INR317b from INR262b in Jul'26.
* Investors continued to park their money in mutual funds. Inflows and contributions in systematic investment plans (SIPs) stood at INR323b in Aug'26 (up 1.1% MoM and +14.3% YoY).
A few interesting facts
* The month witnessed noteworthy changes in the sector and stock allocation of funds. On an MoM basis, the weights of Insurance, Healthcare, Capital Goods, Metals, E-Commerce, NBFC - Non Lending, PSU Banks, Retail, and Real Estate increased, while those of Consumer, NBFC - Lending, Utilities, Private Banks, Oil & Gas, Telecom, Cement, Chemicals, and Logistics moderated.
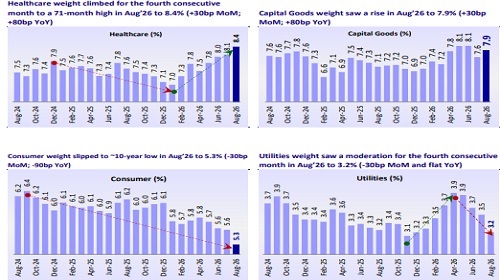
* Healthcare weight climbed for the fourth consecutive month to a 71-month high in Aug'26 to 8.4% (+30bp MoM; +80bp YoY). ? Capital Goods weight saw a rise in Aug'26 to 7.9% (+30bp MoM; +80bp YoY).
* Consumer weight slipped to ~10-year low in Aug'26 to 5.3% (-30bp MoM; -90bp YoY).
* Utilities weight saw a moderation for the fourth consecutive month in Aug'26 to 3.2% (-30bp MoM and flat YoY). ? E-Commerce weight climbed for the fourth consecutive month to an all-time high in Aug'26 to 3.3% (+20bp MoM; +70bp YoY).
* The top sectors where MF ownership vs. the BSE 200 was at least 1% lower were Oil & Gas (20 funds underowned), Private Banks (15 funds under-owned), PSU Banks (13 funds under-owned), Consumer (12 funds underowned), and Technology (11 funds under-owned).
* The top sectors where MF ownership vs. the BSE 200 was at least 1% higher were NBFC-Non-Lending (16 funds over-owned), Healthcare (14 funds over-owned), E-Commerce (10 funds over-owned), Capital Goods (9 funds over-owned), and Chemicals (8 funds over-owned).
* In terms of value change MoM, divergent interests were visible within sectors: The top 10 stocks that witnessed the maximum rise in value were LIC of India, Axis Bank, One 97 Communications, MCX, Kotak Mahindra Bank, Divis Labs, PB Fintech, Lenskart, SBI, and Apar Industries. Conversely, the stocks that witnessed the maximum MoM decline in value were HDFC Bank, Bharti Airtel, ITC, Bajaj Finance, NTPC, Maruti Suzuki, Reliance Industries, PFC, Power Grid Corp, and HUL.
For More Research Reports : Click Here
For More Motilal Oswal Securities Ltd Disclaimer
http://www.motilaloswal.com/MOSLdisclaimer/disclaimer.html
SEBI Registration number is INH000000412











More News

Equity Inflows Moderate in April; Mutual Fund Equity AUM Hits Record Rs 39.1 Trillion: Motil...