Nifty-Bank Nifty SPOT Weekly Outlook from Bharat K Gala, Technical Head, Ventura

Nifty
Previous week it was mentioned that, Our view is negative & below 23796 traders should use 23487- (22600- 21715) levels as an opportunity to buy. If the trend is strong Nifty will bounce back from 22600 levels, any close below should be treated as negative for the current uptrend. Currently, (24415-24790)-25090-(25395-25825) as sell areas. If sustain above 25825 we open for 26347 and later further to 26500-26700 area.
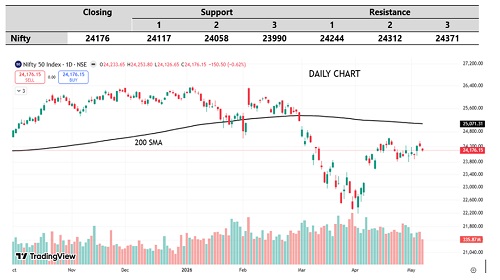
Nifty opened at 24063.55 and initially witnessed a correction marking a low of 23882.05. Thereafter, the index recovered strongly and extended its rally to mark a high of 24482.10, thereby breaching the 24415 level (1st sell area). However, the index faced resistance near the sell area & subsequently, forming Down Gaps, witnessed a valid correction reaching a low of 24126.65. Over the past two weeks, Nifty has been consolidating within a defined range of 24415 – 23796, indicating a phase of indecision between buyers and sellers. Now, Nifty closed at 24176.15.
Below 23882 (current week low), we have support levels at 23487- (22600- 21715) as bounce back levels.
If the trend is strong Nifty will bounce back from 22600 levels, any close below should be treated as negative for the current uptrend. As of now, (24474-24840)-25135-(25430-25850) as sell level areas.
If sustain above 25850 we open for 26347 and later further to 26500-26700 area.
Our view is Sell on rise & below 23882 traders should use 23487- (22600- 21715) levels as an opportunity to buy. If the trend is strong Nifty will bounce back from 22600 levels, any close below should be treated as negative for the current uptrend. Currently, (24474-24840)-25135-(25430-25850) as sell areas. If sustain above 25850 we open for 26347 and later further to 26500-26700 area.
Bank Nifty
Previous week it was mentioned, Our view is negative & below 54440 traders should use 54274-(51954-49640) levels as an opportunity to buy. If the trend is strong Bank Nifty will bounce back from 51954 levels, any close below should be treated as negative for the current uptrend. Currently, (56180-57250)-58120-(58980-60215) as sell level areas. If sustain above 60215 we open for 61765 and later further to (62540-63470) area.
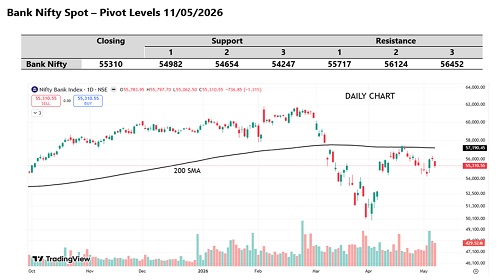
Bank Nifty crossed below 54440 (previous week low) and declined to mark a low of 54221.65. Thereafter, the index witnessed a strong recovery and rallied to mark a high of 56334.15. However, Bank Nifty faced resistance near 56180 (1st sell area) restricted further upside, leading to a valid correction with the index marking a low of 55062.50. Now, Bank Nifty closed at 55310.55.
Below 54221 (current week low), we have support levels at 53930-(52072-49430) as bounce back levels.
If the trend is strong Bank Nifty will bounce back from 52072 levels, any close below should be treated as negative for the current uptrend. As of now, (56010-57112)-58000-(58890-60170) as sell level areas.
If sustain above 60170 we open for 61765 and later further to (62540-63470) area.
Our view is Sell on rise & below 54221 traders should use 53930-(52072-49430) levels as an opportunity to buy. If the trend is strong Bank Nifty will bounce back from 52072 levels, any close below should be treated as negative for the current uptrend. Currently, (56010-57112)-58000-(58890-60170) as sell level areas. If sustain above 60170 we open for 61765 and later further to (62540-63470) area.
SMS subject to Disclosures and Disclaimer goo.gl/8bCMyQ
SEBI Registration No.: INH000001634