Nifty Forms Bullish Base, 23,118 Key Support - ICICI Direct Ltd

Nifty : 23270
Technical Outlook
Day that was ..
Nifty extended its recovery to settle higher at 23270, making a small bullish candle with a higher-high, higher-low formation. Market remains to be quite volatile with see-saw type price action, with overall market breadth improving noticeably, reflecting an easing of panic-driven selling across the board (Nifty advance-decline ratio stood at 36:14). Sectorally, Pharma and Realty led the gainers, while Banking and Oil & Gas ended as the primary laggards.
Technical Outlook :
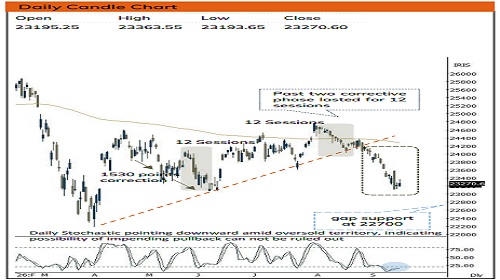
• The daily action resulted in to small bull candle forming higher-high, higher-low sequence. Defending the 23118-panic low remains the pivotal anchor for this localized base, and holding the same in the upcoming sessions will keep options open for an extended pullback rally toward 23500.
• Among momentum indicators RSI showing signs of stabilization, the daily RSI is levelling out near the 20–22 zone. Historically, this band marks an inflection point where aggressive selling pressure exhausts; during the Covid sell-off as well, once the deeply oversold RSI stabilized around these lower thresholds, Nifty staged a strong, sustainable recovery rally.
• Broader market breadth provided strong structural confirmation of broad-based participation, as both Midcap and Smallcap indices provided confirmation after closing above yesterday's hammer-like daily candles while defending their 200-day and 100-day EMAs, respectively (Midcap advance-decline ratio stood at 112:37, Smallcap at 69:31). Holding Wednesday's lows across both indices remains vital to sustain the ongoing pullback.
• Going forward Sustaining above Wednesday's intraday high is a prerequisite to confirm a structural pause in the corrective leg and open an extended pullback toward 23500; else likely to consolidate in the range of 23100–23500.
• From the medium term perceptive, on the down side key support is placed at 22700, coinciding with the 80% macro retracement of the April-August rally, which serves as a major structural floor for the index
• Key Monitorable :
1. Geopolitical Developments
2. Cool off in Crude Oil
Intraday Rational :
• Trend – Higher-high, higher-low structure indicates a pause in the downward trend with an intraday pullback bias
• Levels – Buy around 80% retracement of last 2 days range
Nifty Bank : 56056
Technical Outlook
Day that was :
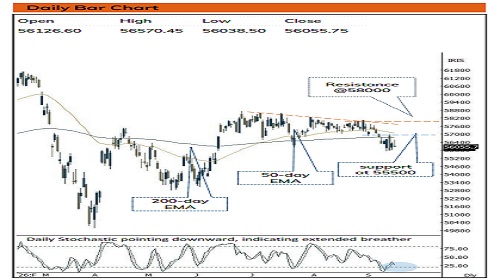
Bank Nifty ended the day on negative note, at 56056 down 0.42% on back of mixed global cues.
Technical Outlook :
• Index started the session with positive opening then faced resistance around 61,8% retracement of last two days decline and ended near low point of the day. The daily price action formed a Inverted hammer like candle, indicating selling at higher levels.
• Index failed to capitalize initial gains and reacted lower and traded in a range 56000-56500 levels and close lower around 56056 levels. It remained largely with Tuesdays bear candle range indicating extended consolidation. Immediate support is placed around 55700-55800 support zone being 50% retracement of May-June rally (52783-58706). Meanwhile, a decisive close above the previous session high of 56570 is required, which has remained elusive for the past seven sessions to confirm a sustained recovery and open the door for a potential pullback towards 57100 being 61.8% retracement of current decline(58025-55700).
• Sustainability below the same would result into extension of corrective bias towards 55500, representing a 38% retracement of the April–June rally (46,935–58,706).
• The PSU Bank Index formed inverted hammer like candle with higher high higher low closing above its 52-week EMA. Going ahead, holding 8150 will lead to pullback towards 8600 levels being 61.8% retracement of current decline.
• Intraday Rational :
• Trend - Prolongation of consolidation around 52 weeks EMA
• Levels: Buy around 80% retracement of last 2 days range
Please refer disclaimer at https://secure.icicidirect.com/Content/StaticData/Disclaimer.html
SEBI Registration number INZ000183631