
Nifty Rally Hits 61.8% Fibonacci Level Near 23,780 - Tradebulls Securities Pvt Ltd

Nifty
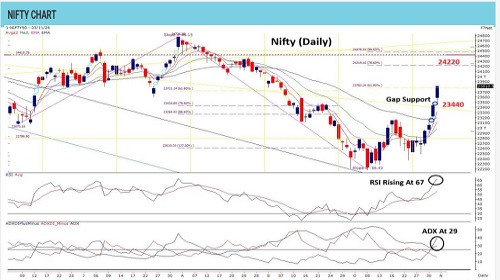
Nifty extended its strong bullish momentum, with the latest rally reaching the 61.8% Fibonacci retracement level near 23780, measured from the fall between 3 August and 8 October 2026. This marks an important recovery milestone, although the index needs to sustain its gains and attract followthrough buying to extend the upmove. The sequence of gap-ups has strengthened the price structure, with the latest gap zone around 23400 emerging as immediate make-or-break support. Momentum indicators remain encouraging. Daily RSI has climbed to 67, reflecting strong buying momentum while still remaining below the conventional overbought threshold. ADX has risen to 29, indicating improving short-term trend strength and supporting the possibility of further directional movement. Sustaining above the 23400 gap support will be crucial to preserve the current momentum. The 5 DEMA at 23316 offers the next immediate support, while the 50 DEMA near 23170 remains the major structural support. On the upside, the 23810 zone is the immediate hurdle, followed by the psychological 24000 mark. The bias remains bullish as long as Nifty holds above 23170. However, the sharp distance from its 5 DEMA indicates a stretched near-term setup, making consolidation or intermittent profit-booking possible. Traders should avoid chasing elevated prices and prefer selective buying on dips, near the gap supports. A decisive break below 23400 would weaken the immediate momentum and trigger the pullback move to bring the 5 DEMA support into focus. Maintain disciplined stop-losses and retain buy on dips strategy.
SEBI Registration number is INH000000081.
Please refer disclaimer at https://geplcapital.com/term-disclaimerg