Nifty Recovers, Holds Above 24,000 Mark - ICICI Direct Ltd

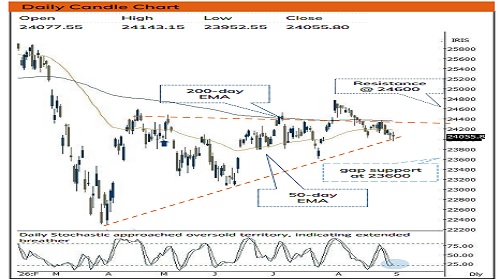
Nifty : 24056
Technical Outlook
Day that was ..
Equity benchmark concluded volatile weekly expiry session on a flat to negative note. Nifty lost 25 points to settle at 24056. Market breadth remained in favour of declines with A/D ratio of 1:1.67. Broader market relatively underperformed as Midcap dropped 1.4% while smallcap lost 0.25%. Sectorally, IT, FMCG staged a pullback while recently rallied pharma, realty, consumer durables seen profit booking.
Technical Outlook :
• Nifty staged a recovery after initial decline. However, lack of follow through strength above previous session high dragged index lower in the second half before settling above psychological mark of 24000. Consequently, daily price action resulted in a doji like candle, indicating rise in volatility in the vicinity of 24000 levels.
• The index is likely to start session on a negative note tracking rise in crude oil prices and bond yield. The index has been trading in the vicinity of 24000 mark after witnessing breakdown from the four months rising channel. However, structurally it is important to highlight that the index has formed sequential higher bottoms off April low (22182). Each higher base has formed a peculiar pattern of arresting intermediate correction around 61.8% retracement of prevailing uptrend. The current ~800 points pullback precisely align with the structural rhythm, retracing 61.8% of JulAug 1150 points rally. We expect index to maintain the same rhythm and form a higher base in coming weeks. On the downside, strong support is placed around 23600 being July low
• Structurally, past five months trading activity has been confined in entire March month’s trading range (24989-22284). Such prolonged range contractions are rare which systematically set the stage for a directional move. Hence, as long as index holds swing low of 23600, we believe buy on dips structure remains intact
• Past two decades of historical data suggest that September has been the volatile month. However, such volatility has paved the way for direction move in subsequent months
• Smallcap index has logged an impressive ~35% rally off April low and reclaimed its all time high after 18 months. The historical data suggest that this is the initial leg of multi-year secular bull run rather than an overextended technical move. We believe that current up move has laid the foundation for a secular up move Our bullish outlook on the broader market is anchored by following key observations:
• A) Major corrections of ~35% or more have historically marked the beginning of a fresh market up-leg rather than the end of the broader bull cycle
• B)Post such correction, uptrends have sustained for subsequent ~20–22 months on average, with significant rally in subsequent year
• C)With current rally (~35%) only five months of its expansion, history suggest that we are just starting the secular up move, where the largest gains are yet to unfold
Key Monitorable :
• Positive development on geopolitical front
• Cool off in crude oil prices
Intraday Rational :
• Trend – Strong buying demand from 4 months rising trend line confirms robust price structure
• Levels – Sell around 50% retracement of Tuesdays range
Nifty Bank : 57410
Technical Outlook
Day that was :
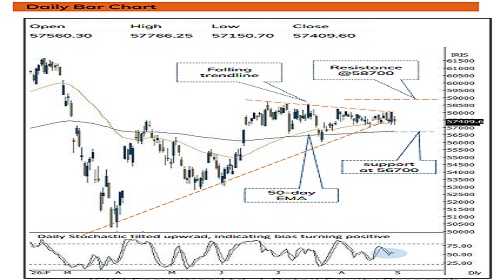
The banking index settled on a flat note, giving back nearly all of the previous session's surge. Bank Nifty ended the weekly Nifty expiry day on negative note down 1.06% at 57410 on back of mixed global cues.
Technical Outlook :
• The Index started the day on negative note and thereafter found supportive efforts from 61.8% retracement of previous day up move and from 50 days EMA. As a result, the daily price action formed bear candle with lower high lower low indicating extended consolidation.
• Despite the deep intraday decline, the index managed to conclude the day within its multi-week consolidation matrix, which remains broadly defined between 57000 and 58000. Crucially, the index is hovering near its major short-term moving average floors. A clean recovery from this floor keeps the breakout trajectory viable, while a deep breakdown past support will lengthen the sideways squeeze.
• In the process, strong support is placed around 56700 being the placement of four months rising trendline coincided with 200 days EMA .
• The PSU Bank Index formed Inside bar indicating extended breather.Going ahead, follow through strength above last week (8760) high would open the door for next leg of up move towards 9100 levels
Intraday Rational :
• Trend - Prolongation of consolidation in vicinity of 50 days EMA, indicating positive bias
• Levels : Sell around 50% retracement of Tuesdays range
Please refer disclaimer at https://secure.icicidirect.com/Content/StaticData/Disclaimer.html
SEBI Registration number INZ000183631











Tag News

Nifty opened with a flat note and witnessed bounce back in initial hours - Jainam