
Sell Copper Around 1235 SL ABOVE 1240 TGT 1225/1215 - Axis Securities Ltd

Macro
• Comex gold prices fell sharply during the morning session, declining by more than 2% to trade near multi-year lows amid a hawkish stance from Federal Reserve officials. The uptick in the US Dollar Index is putting significant pressure on bullion, as gold is a non-yielding asset. This has triggered a notable shift in market sentiment from bullish to bearish. We expect prices to remain under pressure as long as the $4,120 level holds on the upside.
• Nymex crude is trading lower by more than 3% as increased supply from Saudi Arabia has outweighed geopolitical concerns surrounding the Strait of Hormuz. The release of US crude oil inventory data this evening may keep prices volatile during the evening session.
• Copper prices extended their losses following fresh reports that Panama will begin formal negotiations with First Quantum Minerals over a potential restart of its shuttered Cobre Panama copper mine, one of the world's largest copper mines. The development triggered panic selling in the metal. Additionally, a stronger US Dollar Index has added further pressure on industrial metals. The overall trend remains bearish as long as the $6.30 level holds as resistance on the upside.
Panel One
* 15-minute candlesticks for a rolling three-day period have been plotted.
* Blue horizontal line shows an open gap which could either be up or down (open-gap up: low of next candle does not overlap the high of the prior candle, and vice versa for an open-gap down). The horizontal line showing the gap will only appear if the price has not visited the gap area.
Panel Two
* Plots the Slow Stochastics study to identify overbought (90 and above) and oversold (20 and below) areas.
* Signals are generated when the fast line (black) crosses the slow line (blue).
Panel Three
* Plots the Fisher Transform study that helps identify extremes and makes turning points clearer.
* Red bands lie between +2 and +3 and can be thought of as an area where a peak could occur. Green bands lie between -2 and -3 and often mark bottoms.
Gold
SELL GOLD BELOW 131000 SL ABOVE 131600 TGT 130500/129000.
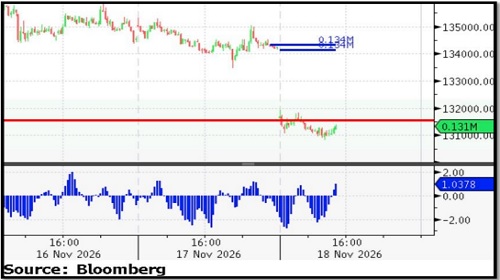
* Nearby Support: 1,31,000/ 1,30,400
* Nearby Resistance: 1,32,000/ 1,33,500
* Nearby Gaps: None
Silver
SELL SILVER BELOW 163000 SL ABOVE 164000 TGT 162000/161000.
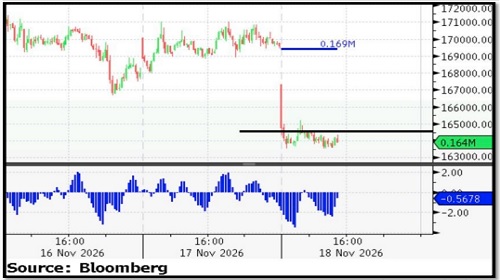
* Nearby Support: 1,63,000/ 1,62,000
* Nearby Resistance: 1,66,500/ 1,69,000
* Nearby Gaps: None
Crude Oil
BUY CRUDEOIL ABOVE 8000 SL BELOW 7920 TGT 8100/8200.
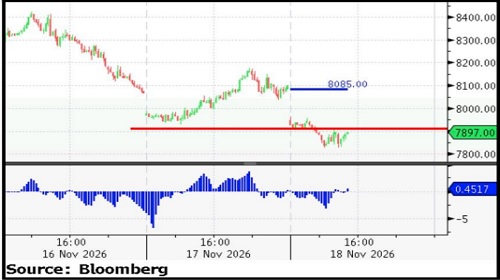
* Nearby Support: 7,800/ 7,700
* Nearby Resistance: 8,000/8,200
* Nearby Gap(s): 8066
Copper
SELL COPPER AROUND 1235 SL ABOVE 1240 TGT 1225/1215.
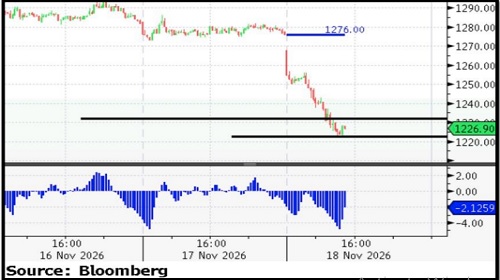
* Nearby Support: 1,215/ 1,200
* Nearby Resistance: 1,235/1,250
* Open Gap(s): None
For More Axis Securities Disclaimer https://simplehai.axisdirect.in/disclaimer-home
SEBI Registration number is INZ000161633










Tag News
Market Round-up 18th November 2026 by Motilal Oswal Wealth Management Ltd