

Short Term Portfoliio 06th April 2026 by GEPL Capital Ltd

Observation
As highlighted in our previous report, the market had already begun to show signs of weakening, which has now unfolded into a sharp deterioration in sentiment.
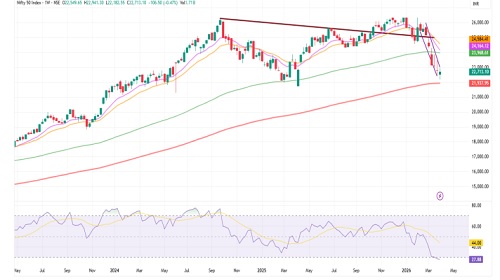
The NIFTY 50 declined significantly during the March series, falling by approximately 11.31% (~2,847 points). This marks one of the weakest closing phases since the 2020 bottom, underscoring the intensity of the recent correction. The broader market structure continues to exhibit a bearish undertone, with the index firmly entrenched in a “sell on rise” regime.
From a technical standpoint, the trend remains fragile, as the index continues to form a sequence of lower highs and lower lows— indicative of sustained selling pressure at higher levels. The inability to maintain rebounds further reinforces the cautious sentiment, suggesting that any near-term rallies are likely to be utilized as exit opportunities rather than fresh buying triggers.
On the seasonality front, the January–March quarter has historically been a weaker period for the market since 2008. However, the outlook tends to improve as we enter the April–May phase, which has demonstrated a strong historical bias with a positive occurrence rate of around 72%, along with an average gain of ~10% compared to an average drawdown of ~5%.
In terms of momentum, the RSI has slipped into the oversold zone, trading below the 30 mark, indicating stretched downside conditions. At the same time, the index is approaching a crucial long-term support near the 200-week EMA, currently placed around 21,937. This confluence of oversold momentum and key support enhances the probability of a near-term relief rally towards the 23,500–23,700 zone. A sustained move above this range could potentially extend the recovery towards the 25,000 level.
From a strategy perspective, short-term traders are advised to continue with a “sell on rise” approach as long as the index remains below 23,800. Meanwhile, long-term investors may consider the 21,900–21,700 zone as an attractive accumulation range, with a broader upside potential targeting 26,277 over the longer term.
Aurobindo Pharma Ltd
Observation
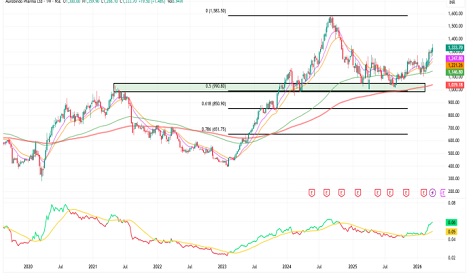
* On the weekly timeframe, AUROPHARMA is forming a well-defined structural base near the polarity zone of its 2021 swing high, which also aligns with the 50% Fibonacci retracement level adding significance to the support region.
* The stock is comfortably positioned above its key moving averages, including the 12, 26, and 50 week EMAs, indicating sustained trend strength and a positive underlying bias.
* Notably, it has delivered a decisive breakout from a 13 month consolidation range in March 2026, supported by a strong closing. This price action highlights resilience and outperformance despite broader market volatility.
* Further reinforcing the bullish outlook, the RSC indicator continues to trend higher above its average and has broken out of a multi-year declining trend line originating from 2016 signaling strong relative outperformance against the broader market.
About Company
Aurobindo Pharma Limited is currently ranked as the 3rd largest listed Indian pharma company by revenue. It is involved in the development, manufacture, and commercialisation of a wide array of products across several therapeutic areas, including the Central Nervous System (CNS), Cardiovascular (CVS), AntiRetrovirals (ARV), Antibiotics, and Anti-Diabetics.
Investment Rationale
* The company is driving profitability through supply chain integration and operational efficiencies, led by the ramp-up of the Lyfius Pen-G facility (10,000+ MT capacity), which reduces import dependence and, along with the government’s MIP on key antibiotics, supports margin expansion. EBITDA margins remain strong at 20.5% in Q3FY26, with management guiding for a sustainable 20–21% range, backed by stable gross margins (~59.7%) and cost optimization via China-to-Europe supply shifts.
* Aurobindo is positioning for the next phase of pharma growth by investing in complex generics and biosimilars, with CuraTeQ building a 15-product biosimilar pipeline targeting a $50+ billion market and key assets like Omalizumab and Denosumab nearing regulatory filings by 2026. The company is also scaling high-value segments such as dermal, nasal, and respiratory generics while advancing its TheraNym biologics CMO facility, which has already secured global clients like MSD.
* Aurobindo Pharma is executing a diversified global growth strategy, transitioning beyond generics with Europe emerging as a key driver, expected to surpass €1 billion revenue by FY26, supported by strong 27.4% YoY growth across core markets like France, Germany, and the Netherlands. The US business remains resilient with stable core operations and 17% YoY growth in injectables, further strengthened by the Lannett acquisition, especially in controlled substances. Additionally, expansion into growth markets like China, with its OSD facility scaling toward 2 billion units capacity and targeting EBITDA break-even by Q4FY26, is set to drive incremental profitability from FY27.
NLC India Ltd
Observation
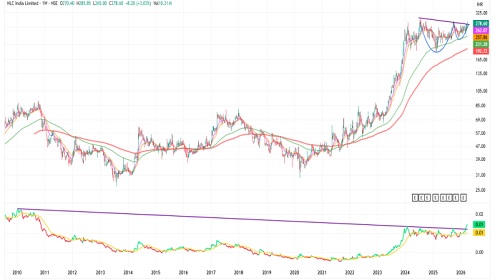
* NLCINDIA has been in a sustained uptrend since 2020, consistently forming higher bottoms throughout the broader upcycle, reflecting strong structural strength.
* Over the past ~1.5 years, the stock has undergone a healthy consolidation phase and developed a classic cup-and-handle pattern on the weekly scale. It is now hovering near the breakout zone, indicating a potential continuation of the primary uptrend.
* Despite ongoing market volatility driven by global uncertainties, the stock remains well positioned above its key moving averages namely the 12, 26, and 50 week EMAs highlighting underlying resilience and trend stability.
* Additionally, the RSC indicator has registered a multi-year breakout above a declining trend line drawn from the 2009 swing high. The ratio line trending above its average further reinforces a robust relative strength setup, suggesting continued outperformance ahead.
About Company
NLC India Limited is evolving from its origins in lignite mining and thermal power generation to becoming a pioneer in renewable energy and a growing player in coal mining and critical minerals. It operates four opencast lignite mines with a combined capacity of 30.10 MTPA. The company is on an aggressive growth trajectory to transform into a multi-fuel energy leader by 2030
Investment Rationale
* The company is undergoing a massive shift from a lignite-centric mining company to a diversified energy leader, aiming for a 50:50 ratio between thermal and renewable energy (RE) capacity by 2030. It aims to increase its renewable capacity from the current 1,599 MW to 10,110 MW by 2030. This involves a projected capital expenditure of Rs.41,599 crore specifically for green energy projects over the next five years. NLC India has formed a wholly-owned subsidiary, NLC India Renewables Limited (NIRL), to house its RE assets. The company plans to monetize these assets, targeting Rs.4,000 crore to fund further equity requirements.
* NLC India’s core strength lies in its integrated mine-cum-power model, where pithead thermal stations are fueled by its own captive mines, ensuring energy security and high operational efficiency. The company’s earnings are largely driven by a regulated return on equity (typically 14-15%). Management projects that regulated equity will double from the current Rs.9,383 crore to more than ?19,000 crore by 2030. To support this equity growth, NLCIL is doubling its mining capacity from 50.1 MTPA to 104.35 MTPA and increasing total power generation from ~6.7 GW to over 20 GW by 2030.
* Beyond traditional power and mining, NLCIL is diversifying into high-margin and strategic sectors that "future-proof" the business against the global energy transition. The company is expanding its mining expertise into critical minerals (Phosphorite and Limestone in Chhattisgarh) and exploring lithium blocks in Mali. With a low Debt-to-Equity ratio of 1.20 (against a regulatory limit of 2.33), the company has significant "huge potential for borrowings" to fund its Rs.1.17 lakh crore capex plan.
Ather Energy Ltd
Observation
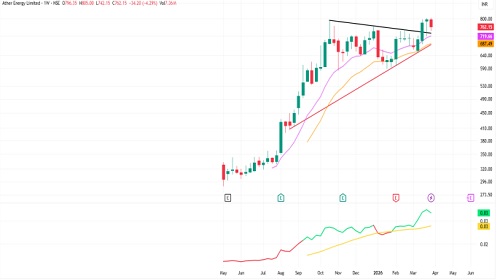
* ATHERENERG has been in a steady upward trajectory since its listing, reflecting a strong underlying trend and sustained buying interest.
* In the recent weeks, the stock has broken out of a 21-week consolidation phase with a strong bullish candlestick. This breakout was further validated in the following week, where the stock closed above the breakout candle and formed a long lower wick indicating buying support at lower levels and positive sentiment.
* The stock continues to trade above its key moving averages, particularly the 12- and 20- week EMAs, which reinforces the ongoing trend strength and provides a cushion against near-term volatility.
* On the relative performance front, the RSC indicator is trending above its average, highlighting strong relative strength even amid a weak broader market environment, and suggesting potential for continued outperformance.
About Company
Ather Energy Limited is a pure-play electric vehicle (EV) company based in India that specialises in the design and manufacture of electric two-wheelers (E2Ws) and their supporting ecosystem. The company’s business model is vertically integrated, meaning they design and own most of their technology in-house, including 80% of key hardware and 100% of the software stack.
Investment Rationale
* Ather Energy has successfully transitioned from a regional player to a national contender by leveraging its dominance in South India to fuel growth in "Middle India" and the rest of the country. The company's "Middle India" strategy, focusing on Gujarat, Maharashtra, Madhya Pradesh, Chhattisgarh, and Odisha, has seen market share jump from 4% in Q1 FY25 to 17.4% by Q3 FY26. This growth is driven by a rapid, asset-light distribution expansion; the company grew its network from 351 stores in FY25 to 600 stores by late FY26, with a target of 700 by the end of the fiscal year.
* The upcoming EL platform represents Ather's pivot toward the mass market without sacrificing profitability. Designed for cost and scalability, the EL platform features a lower-cost architecture (including a steel frame and enclosed gearbox) and integrated components like the AC/DC (Ather Charge Drive Controller). This platform allows Ather to enter the Rs.1 lakh to Rs.1.25 lakh price segment, a "white space" where they previously lacked a competitive product. Furthermore, the transition to LFP (Lithium Iron Phosphate) battery packs and the operationalization of "Factory 3.0" in Maharashtra (AURIC) are expected to drive further bill-of-materials (BOM) reductions.
* Ather’s investment in R&D and proprietary technology serves as a significant moat, enabling best-in-class unit economics. The company has filed 417 patents and manages a vertically integrated stack, including hardware and the AtherStack software. This technological edge has facilitated a massive improvement in adjusted gross margins (AGM), which rose from 9% in FY24 to 25% in Q3 FY26. A critical component of this thesis is the non-vehicle revenue, which reached 14% of total income in Q3 FY26.
Great Eastern Shipping Company Ltd
Observation
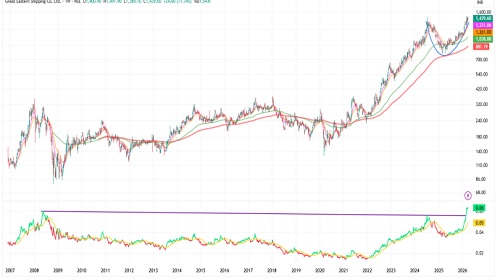
* GESHIP has demonstrated robust structural development since 2020, highlighting a sustained long-term uptrend supported by strong price action.
* Zooming into the current phase, the stock has been outperforming the broader market since April 2025. It has formed a saucer-shaped base and remains well positioned above its key 12- and 20-week EMAs, indicating underlying trend strength and stability.
* On the daily timeframe, the stock continues to form higher highs and higher lows while consistently taking support near the 26-day EMA, reflecting a bullish mean reversion setup and sustained buying interest on dips.
* From a relative performance perspective, the RSC indicator signals strength, with the stock breaking above its multi-year swing high of 2008. This breakout suggests a strong relative momentum and indicates the potential for continued outperformance going forward.
About Company
Great Eastern Shipping Company Limited, is India’s largest private sector shipping service provider and maintains a significant presence in the international maritime industry. The company specializes in the marine transportation of crude oil, petroleum products, gas, and dry bulk commodities. The company operates a diverse fleet consisting of tankers (crude, product, and LPG carriers) and dry bulk carriers.
Investment Rationale
* Global shipping markets are entering a favourable supply demand cycle as limited fleet expansion driven by high shipbuilding costs, stricter environmental regulations, and constrained shipyard capacity coincides with rising energy and commodity trade, supporting stronger freight rates, improved margins, and revenue growth for The Great Eastern Shipping Company Limited, with the offshore segment also benefiting from higher rig utilisation and improving day rates.
* GE Shipping has diverse portfolio of vessel with total vessel count stand at 41 as of Q3FY26. the vessels comprising of 27 tankers (5 Crude tankers, 17 Product tankers, 5 LPG carriers) and 14 Dry Bulk carriers (2 capsize, 9 kamsarmax, 1 Ultramax, 2 Supermax) leading to 3.25 mn dwt capacity. GE shipping is at 100% utilization to its current capacity. The company recently has added new dry bulk carriers of 81,094 dwt, the vessel is expected to join company fleet by Q1FY27 which will continue the growth trajectory in top line as well as in bottom line.
* The company has strong balance sheet with Cash of INR 5,438 Cr which is 31% of the balance sheet. As of Q3FY26 company remain Net debt free with debt of INR 1,254 Cr. The resilient balance and strong cash position in balance sheet creating ample of rooms for adding new vessels. As of Q3FY26 company is running approx. at 100% utilization level o current capacity any new vessels addition will provide incremental growth in topline. We expect revenue to grew by 10% CAGR over FY25 to FY28.
Aditya Infotech Ltd
Observation
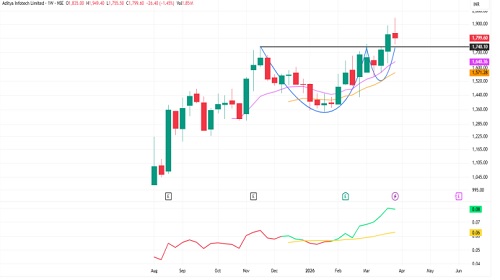
* CPPLUS has been forming a series of higher bottoms since its listing in August 2025, indicating a developing uptrend and improving price structure.
* In the recent week, the stock has delivered a breakout from a cup-and-handle bullish pattern on the daily timeframe. It remains well positioned above its key 12- and 20-day EMAs, reflecting positive sentiment and sustained buying interest.
* Additionally, the RSC indicator continues to trend higher above its average, highlighting strong relative strength and suggesting the potential for continued outperformance.
About Company
Aditya Infotech Limited is the largest Indian-owned provider of advanced video security and surveillance products, solutions, and services, operating primarily under its flagship 'CP PLUS' brand. The company has grown into a major market leader with a 20.8% market share in the Indian video surveillance industry as of Fiscal 2025. The company offers end-to-end security solutions for both enterprise and consumer segments.
Investment Rationale
* The company has outlined a capex plan of Rs.100–150 crore to scale capacity from 17.2 million units in FY25 to 25.2 million units by FY28, with current utilization at 77.1%. This expansion, along with improving utilization, provides a clear runway for sustained growth. Revenue visibility remains strong, supported by multiple levers: capacity addition, better utilization, and product mix improvement. Management has guided for FY27 revenue of Rs.5,350–5,550 crore, driven by ~20% volume growth and an ~8% price increase, indicating a structurally double-digit growth trajectory over the medium term.
* Aditya Infotech’s EBITDA margins are expected to improve from ~8% to 12% by FY27, driven by a product mix shift toward high-value IP cameras, which command 3–3.5x higher realizations than legacy HD cameras. Additionally, strategic initiatives such as backward integration into raw materials and collaboration with Qualcomm for AI-enabled products are likely to enhance cost efficiencies and support premium pricing, making the 12% margin target sustainable going forward.
* The company maintains a strong cash position with positive operating cash flows, comfortably supporting its planned capex of ?100–150 Cr through FY28. Debt has significantly reduced from Rs.427 Cr in FY23 to Rs.126 Cr in 2HFY26, while cash stands at Rs.237 Cr, keeping the company net debt-free and well-positioned for future expansion. Working capital remains well managed, with stable debtor and receivable cycles. With most debt repaid by 2HFY27, finance costs are expected to decline, driving a meaningful improvement in PAT from FY27 onwards.
SEBI Registration number is INH000000081.
Please refer disclaimer at https://geplcapital.com/term-disclaimer


More News
_Securities_(600x400).jpg)
Breakaway gap, RSI strong; above 26050 targets 2633026000 support -Tradebulls Securities Pvt...

