Weekly Derivatives Insights 01th May 2026 - Axis Securities

Nifty
Bank Nifty
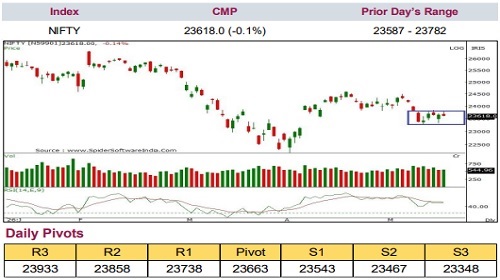
* Nifty started the week on a strong note amid optimism over a possible US-Iran agreement that could ease global energy prices. Nifty crossed the 24,000 mark in the first half of the week; however, the absence of further cues on the situation and MSCI rebalancing resulted in profit booking towards the weekend.
* The index eventually closed at 23,548, losing 171 points for the week.
* For the third consecutive week, the benchmark index remained rangebound within the 23,300–24,000 zone, reflecting a lack of decisive momentum on either side, with a breakout likely to determine the next directional move.
* For bulls to regain control, Nifty needs to close decisively above the consolidation range resistance of 24,000-24,100 levels.
* On the downside, any violation of 23,400-23,300 levels on a closing basis may cause further profit booking, dragging the index towards the 23,000 level.
* Momentum indicators remain neutral to negative, with the weekly RSI flattening below its reference line, signalling an absence of strong directional momentum.
Bank Nifty
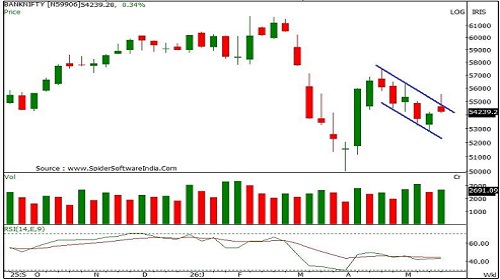
* Bank Nifty started the week on a strong note but faced profit booking near the key resistance level of 55,500, which wiped out most of the early gains and led the index to close on a flat note. The index ended Friday at 54,239, registering a weekly gain of 184 points.
* On the weekly chart, the index formed a bearish candle with a long upper shadow, indicating resistance and profit booking at higher levels.
* Technically, a decisive move above 55,600 could trigger fresh buying momentum and push the index toward the 56,300-57,000 zone. On the downside, a break below 54,000 may lead to renewed selling pressure, dragging the index towards the 53,300– 52,800 zone.
* For the week ahead, Bank Nifty is expected to trade within the 55,600– 53,300 range with a mixed bias.
* Momentum indicators continue to remain subdued, with the weekly RSI hovering around its reference line. A bullish crossover in the weekly RSI could indicate a strengthening positive bias and improve the index’s near-term outlook.
AIA Engineering Limited
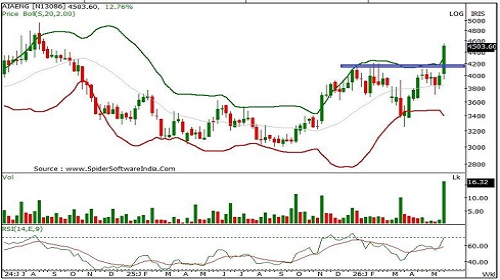
* On the weekly chart, AIAENG has delivered a decisive breakout from a five-month “multiple resistance zone” of 4,220 levels, backed by a strong bullish candle, signalling the resumption of the prior uptrend on the medium-term time frame.
* The breakout is supported by a sharp surge in volumes, underscoring strong market participation and conviction behind the move.
* The stock is firmly positioned above its 20-, 50-, 100-, and 200-day SMAs, with all key averages trending higher in alignment with price action, confirming a robust bullish structure.
* Momentum indicators remain firmly supportive, with the weekly RSI holding above its reference line, reflecting strengthening bullish momentum and reinforcing the positive outlook.
* The above analysis indicates an upside toward 4,825-4,920 levels.
* The holding period is 3 to 4 weeks.
Exide Industries Limited
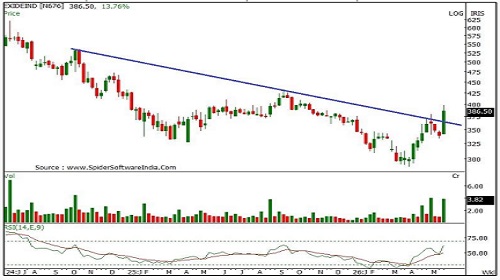
* On the weekly chart, EXIDEIND has delivered a decisive breakout from the past couple of years’ “downward-sloping trendline” resistance at the 367 level, supported by rising volumes, signalling the trend reversal of the medium-term uptrend.
* The stock continues to form a higher tops and bottom formation on the daily and weekly time frame and is holding firmly above its 20-, 50-, 100-, and 200- day SMAs, reconfirming a sustained positive bias.
* Momentum indicators remain firmly supportive, with the weekly RSI holding above its reference line, indicating strengthening bullish momentum.
* Additionally, the daily and weekly “Bollinger Band” buy signal further validates the increased momentum and reinforces the positive outlook.
* The above analysis indicates an upside toward 418-430 levels.
* The holding period is 3 to 4 weeks.
Adani Total Gas Limited
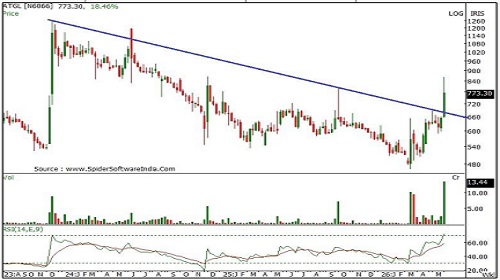
* On the weekly chart, ATGL has delivered a decisive breakout above the four-year “down-sloping trendline” at 677, supported by a strong bullish candle, signalling a major trend reversal.
* The breakout is accompanied by a notable surge in volumes, indicating strong market participation and validating the strength of the move.
* The daily price action remains well positioned above the 20-, 50-, 100-, and 200-day SMAs, with all key moving averages trending higher alongside prices, indicating a strong and sustained bullish trend.
* Additionally, the daily, weekly and monthly RSI breakout above its reference line further reinforces positive sentiment and confirms the robustness of the price action.
* The above analysis indicates an upside toward 860-900 levels.
* The holding period is 3 to 4 weeks.
For More Axis Securities Disclaimer https://simplehai.axisdirect.in/disclaimer-home
SEBI Registration number is INZ000161633